
In Dealmaker’s Digest, read the top 10 latest developments in global transactions. We offer insights into M&A activity across industries and borders. To receive our M&A thought leadership, please join our mailing list.
Key Takeaways
- Q2 2026 recorded highest deal value in recent history: With $1.7 trillion in global deal value, Q2 marked the highest quarterly value this century. Monthly deal value also reached a five-year high.
- Mega-deals mask declining deal activity: While the number of $10 billion-plus deals nearly doubled and deal values boomed year-over-year in 1H 2026, deal counts fell sharply–quarterly global count and outbound count hit decade lows.
- The widening strategic-sponsor gap: Since Q4 2025, strategic deal value has risen precipitously even as financial deal value has fallen. The gap widened significantly in Q2 2026, with strategic activity increasing 31% quarter-over-quarter and sponsor deal value declining 9%.
Global M&A Activity Update
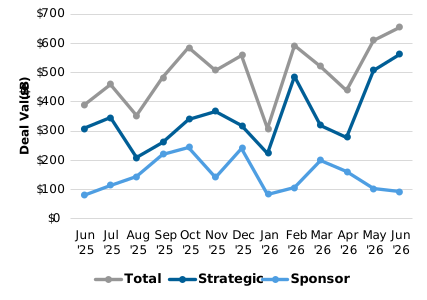
 Monthly Deal Value Trends

Aggregate global monthly deal value1 in June was up moderately (+8%) from May to a new five-year monthly record with over $650 billion. Year-over-year, deal value was up 71%.
Strategic buyer deal value was up 11% in June from May to over $560 billion, bolstered by 10 deals over $10 billion, including SpaceX’s $60 billion acquisition of Cursor. Year-over-year, strategic value was up 84%.

Financial, or sponsor, buyer deal value declined 8% from May to June, notching below $100 billion as sponsors pulled back for the third consecutive month. Year-over-year, however, sponsor deal value was up 18%.
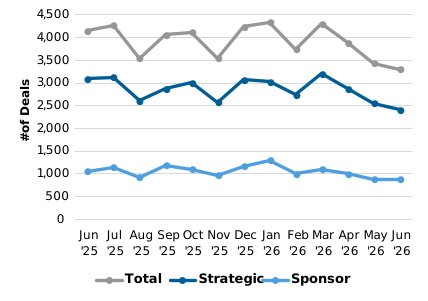
 Monthly Deal Count Trends
Global deal count in June declined 4% from May to about 3,300 transactions, the lowest count in nearly three years. Year-over-year, global deal count was down 20%.
Strategic buyer deal count was down 5% from May to June to approximately 2,400 transactions, the lowest count in more than two years. Year-over-year, strategic buyer deal count declined 22%.
 Sponsor buyer deal count in June held steady (+1%) month-over-month but declined 16% year-over-year.
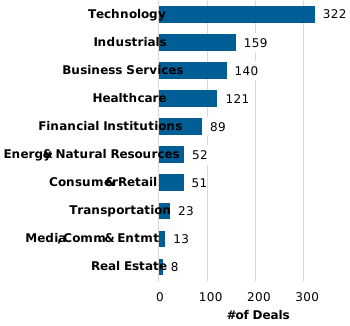
Monthly Active M&A Industries (U.S. Targets)
 By Deal Count
- The technology industry remained at the top for U.S. M&A activity by deal count in June, continuing its multi-year streak as the leading industry by volume.
- The industrials and business services2 sectors rounded out the most active sectors in June by deal count.
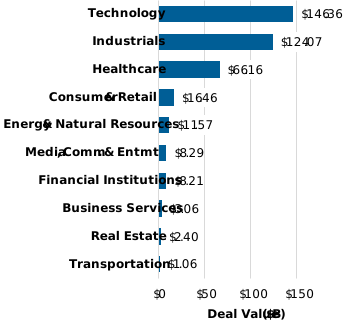
 By Deal Value
- The technology industry also topped the charts for U.S. M&A activity by deal value in June (with mega-acquisitions of Cursor and Roku accounting for nearly 60% of total).
- The industrials sector came in a close second, led by the Lhoist acquisition highlighted below. Healthcare took third, spurred by three billion-dollar+ transactions.

Monthly Blockbuster Deals
Largest U.S. Industrials Deal
- Martin Marietta has agreed to combine with Lhoist in a cash and stock transaction valued at $13.5 billion.
Largest U.S. Technology Deal
- SpaceX has agreed to acquire Cursor in an all-stock transaction valued at $60 billion.
 Monthly Inbound U.S. M&A Activity
 By deal value, inbound U.S. activity in June more than doubled (+121%) from May, with the top three deals (including UK-based GSK’s $10.6 billion acquisition of Nuvalent and Germany-based Merck’s $11.3 billion acquisition of Bio-Techne) accounting for over 50% of total. Year-over-year, inbound deal value was up 144%.
By deal count, acquisitions of U.S. targets by ex-U.S. buyers in June increased moderately (+8%) from May. Year-over-year, inbound deal count was up 9%.
- Canada- and UK-based acquirers undertook the largest number of inbound transactions in June with 35 and 33 respectively, followed by Japan and France.

 Monthly Outbound U.S. M&A Activity
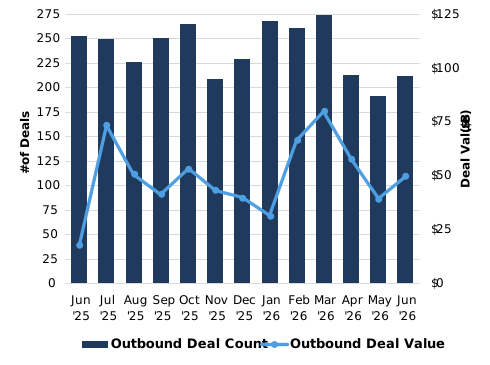
By deal value, acquisitions of ex-U.S. targets by U.S. buyers in June increased 26% from May to approximately $50 billion. Year-over-year, outbound deal value jumped 175% from June 2025’s 13-month low.
Outbound deal count was up 10% in June to just over 200 transactions. Year-over-year, outbound deal count decreased 16%.
- In June, U.S. acquirers predominantly looked to targets in the UK with 52 deals. Canada and Germany trailed behind; Australia and India were also popular partners.
 Quarterly Global M&A Activity
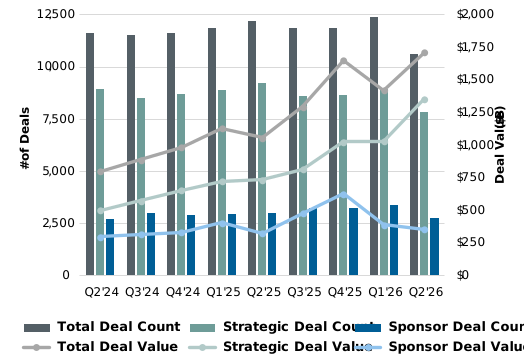
- Global Q2 2026 M&A activity was mixed compared to Q1. While deal count declined (-14%), deal value was up significantly (+20%), reflecting larger and more selective dealmaking. The $1.7 trillion global deal value recorded in Q2 reflects the highest aggregate quarterly value ever, even outpacing the most robust post-pandemic quarters.
- Strategic buyer activity led the jump, increasing 31% quarter-over-quarter to $1.4 trillion, making up nearly 80% of the market and widening the gap between strategic and sponsor shares. Strategic deal count was down 13%.
- Sponsor buyer deal value declined 9% quarter-over-quarter. Compared to the same period last year (Q2 2025), deal value was up 10%. Sponsor deal count was down 19% from Q1.
 Quarterly U.S. Crossborder Activity
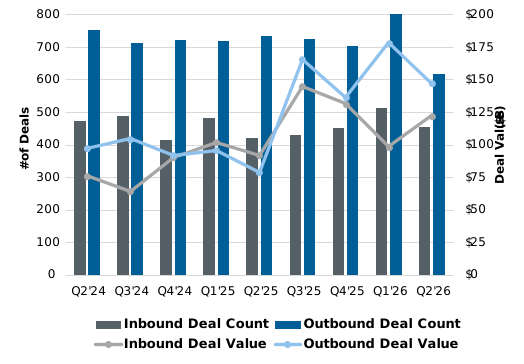
- U.S. crossborder activity was mixed in Q2 2026 quarter-over-quarter, with inbound deal value jumping 24% and outbound deal value declining 17%. Similar to the global market, deal count dropped for both inbound and outbound activity (-11% and -23%, respectively).
- Despite a moderate pullback from Q1, outbound deal value in Q2 was the third highest quarterly value since 2022 with nearly $150 billion; outbound deal count was the lowest in a decade at just over 600 transactions.
- Inbound M&A activity in Q2 posted more modestly at about $120 billion across 450 deals. Year-over-year, quarterly value jumped 33% from Q2 2025, and volume increased 8%.
 2026 First-Half Recap
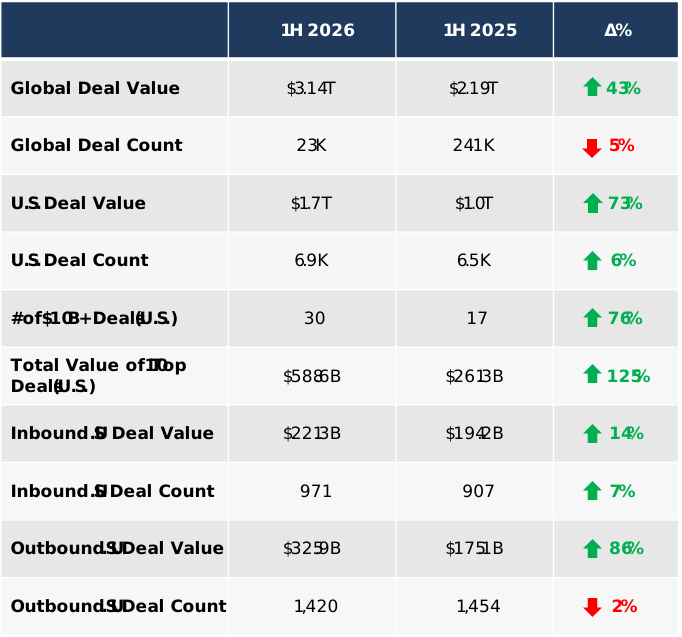
The first half of 2026 (1H) saw significant jumps in deal activity across a large segment of metrics: global deal value, U.S. deal value, and outbound deal value all rose sharply compared to 1H 2025. Mega-deal activity drove much of this growth – the number of $10 billion-plus deals nearly doubled year-over-year, and the aggregate value of the top 10 deals surged as larger transactions carried the market. Deal count metrics reflect a more measured deal landscape: global and outbound deal counts each declined slightly, reflecting fewer but substantially larger transactions driving the period’s gains.
A snapshot of 1H 2026 metrics, and how they stack up against last year’s midway point:
- Unless otherwise noted, charts compiled using Mergermarket data for July 2026 as of August 5, 2026. Aggregate deal values by dollar amount are calculated from the subset of deals with disclosed values.
- Data pulled from Deal Point Data for companies $500m+. Graphics depict activity between 1/1-8/5 in each of 2026 and 2026. Due to rounding, values may not add up to 100%.
- Drakes Landing Associates, L.P. v. Tilden Park Capital Management, L.P. (Del. Ch. July 29, 2026).























Stay Up To Date with Ropes & Gray
Ropes & Gray attorneys provide timely analysis on legal developments, court decisions and changes in legislation and regulations.
Stay in the loop with all things Ropes & Gray, and find out more about our people, culture, initiatives and everything that’s happening.
We regularly notify our clients and contacts of significant legal developments, news, webinars and teleconferences that affect their industries.