
In Dealmaker’s Digest, read the top 10 latest developments in global transactions. We offer insights into M&A activity across industries and borders. To receive our M&A thought leadership, please join our mailing list.
Key Takeaways
- M&A activity in July was down nearly across the board from June’s spikes, apart from global sponsor deal value, which posted a moderate improvement.
- The healthcare and industrials sectors, each driven by multibillion-dollar deals, led industry value in July, narrowly outranking the technology sector.
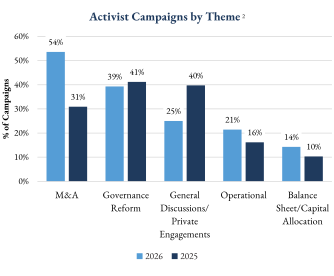
- M&A demands in activism are on the rise—more than 50% of shareholder campaigns YTD included an M&A theme.
Global M&A Activity Update
 Deal Value Trends

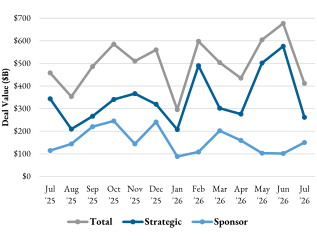
Aggregate global monthly deal value1 in July fell 39% from June to approximately $410 billion, the lowest monthly value since January. Year-over-year, aggregate deal value was down 10%.
Strategic buyer deal value drove the pullback, down 55% month-over-month to about $260 billion. Year-over-year, strategic deal value was down 24%.

Financial, or sponsor, buyer deal value increased 48% from June to July to approximately $150 billion, roughly in line with the trailing 13-month average. Sponsor deal value was up 31% year-over-year.
 Deal Count Trends
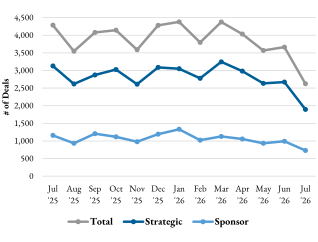
Global deal count in July fell 28% month-over-month to just over 2,600 transactions, the lowest monthly count in over two years. Year-over-year, aggregate deal count declined 39%.
Strategic buyer deal count in July was down 29% from June and 39% year-over-year.
Sponsor deal count in July was down 26% from June and down 37% year-over-year.
Active M&A Industries (U.S. Targets)
 By Deal Value
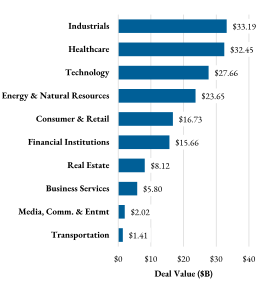
- The industrials sector was the most active in July by deal value, followed closely by the healthcare sector. Both were driven by multiple multibillion dollar deals, including the $14.5 billion acquisition of Solstice highlighted below.
- The technology sector came in third by value for the month.
 By Deal Count
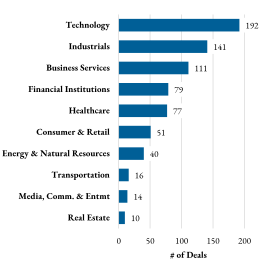
- The technology sector was the most active for U.S. M&A activity by deal count in July, continuing its streak as the leading sector by volume (but noticeably down over 40% from last month’s 330+ transactions).
- The industrials and business services sectors rounded out the most active sectors again in July by deal count, together accounting for about a third of July deals.
Monthly Blockbuster Deals
 Largest U.S. Strategic Deal
- Solstice has agreed to acquire Element Solutions in a cash and stock transaction valued at $14.5 billion.
 Largest U.S. Sponsor Deal
- Brookfield has agreed to acquire Aypa in a transaction valued at approximately $7 billion.
 Inbound U.S. M&A Activity
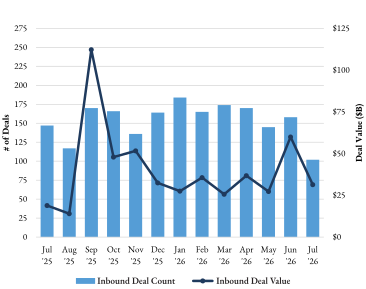
By deal value, inbound U.S. activity dropped 48% from June to July, with only two deals above $5 billion. However, year-over-year, inbound deal value was up 66%.
By deal count, acquisitions of U.S. targets by ex-U.S. buyers in July fell 35% from June to just over 100 deals. Year-over-year, inbound deal count was also down 31%.
- UK-based acquirers had the largest number of inbound transactions in July (with 19), followed by Canada, Germany, and Sweden.
 Outbound U.S. M&A Activity
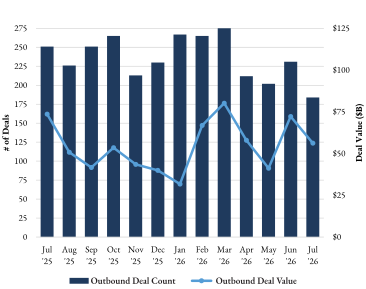
By deal value, acquisitions of ex-U.S. targets by U.S. buyers in July declined 22% from June but remained just above the 13-month average. Year-over-year, outbound deal value was down 24%.
Outbound deal count dropped 20% from June to July and was down 27% year-over-year.
- In July, U.S. acquirers looked predominantly to targets in the UK (38 deals), followed by Germany and Canada. India and Israel were also popular partners.

Activism Update: M&A Activism Trending Up
- M&A overtook governance reform as activists’ primary campaign objective in 2026. M&A-related demands appeared in 45 of 83 campaigns launched through August, more than double the 21 recorded in the comparable 2025 period.
- Overall campaign volume continues to climb, with activity (through August, in each case) jumping nearly 25% year-over-year. Activism remains a year-round endeavor rather than a seasonal phenomenon.
- A more robust deal environment, alongside a more challenging set of developments regarding universal proxy rules and advance notice bylaws, has shifted activist energy toward transactions and away from traditional corporate governance campaigns.
 Delaware Court of Chancery Provides First Guidance on PBC Sales
- Directors of a Delaware public benefit corporation (PBC) are statutorily required to balance stockholders’ pecuniary interests alongside the best interests of stakeholders materially impacted by the company’s conduct and the PBC’s stated public benefit itself, as set forth in Section 365(a) of the Delaware General Corporation Law (DGCL).
- These statutory obligations diverge from longstanding Delaware jurisprudence (e.g., "Revlon” duties) requiring traditional corporate boards, when approving a change of control transaction, to singularly focus on maximizing near-term stockholder value.
- In Drakes Landing,3 a case of first impression, the Delaware Court of Chancery (the “Court”) confirmed that Revlon does not impose a price-maximizing standard of conduct on PBC directors navigating a sale of control.
- The Court’s opinion is deferential to the DGCL framework governing PBCs, including the safe harbor contained in Section 365(b), which protects PBC directors whose tripartite balancing decisions are informed, disinterested, and do not constitute waste (as interpreted by the Court).
- Plaintiffs failed to plead facts sufficient to rebut this safe harbor, which led the Court to dismiss all claims, including aiding-and-abetting claims against the PBC’s majority holders.
- We previously highlighted this tension between the PBC statute and Delaware caselaw, among other practical observations, in our 2023 publication Insights from Experience: Acquiring Public Benefit Corporations.
- Unless otherwise noted, charts compiled using Mergermarket data for July 2026 as of August 5, 2026. Aggregate deal values by dollar amount are calculated from the subset of deals with disclosed values.
- Data pulled from Deal Point Data for companies $500m+. Graphics depict activity between 1/1-8/5 in each of 2026 and 2026. Due to rounding, values may not add up to 100%.
- Drakes Landing Associates, L.P. v. Tilden Park Capital Management, L.P. (Del. Ch. July 29, 2026).























Stay Up To Date with Ropes & Gray
Ropes & Gray attorneys provide timely analysis on legal developments, court decisions and changes in legislation and regulations.
Stay in the loop with all things Ropes & Gray, and find out more about our people, culture, initiatives and everything that’s happening.
We regularly notify our clients and contacts of significant legal developments, news, webinars and teleconferences that affect their industries.