
In Dealmaker’s Digest, read the top 10 latest developments in global transactions. We offer insights into M&A activity across industries and borders. To receive our M&A thought leadership, please join our mailing list.
Key Takeaways
- Global M&A activity declined in Q3 from a record-setting Q2: Global deal value fell 28% quarter-over-quarter to about $1.2 trillion, and deal count fell 17%. September capped the subdued quarter: Monthly deal value was flat with August, and deal count fell to just under 3,000 transactions, a three-year low.
- Quarterly strategic activity pulls back despite a rebound in September: While strategic buyer deal value rose 35% from August, it fell 43% quarter-over-quarter and was down 6% year-over-year. Strategic buyers saw deal count drop by 20% from Q2 2026.
- Sponsors led the quarter but faded in September: Sponsor buyer deal value rose quarter-over-quarter, up 26% from Q2 2026. However, it fell 47% from August to September to about $90 billion, the lowest sponsor value in the trailing 13 months.
- Crossborder activity softened: In Q3 2026, U.S. outbound deal value fell 24% quarter-over-quarter, and inbound and outbound deal counts dropped 22% and 10%, respectively.
Global M&A Activity Update
 Monthly Deal Value Trends

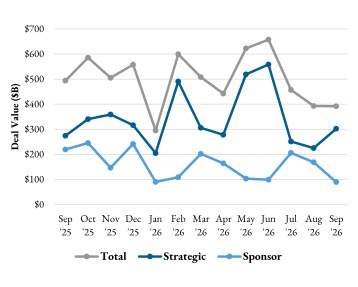
Aggregate global monthly deal value1 in September held steady (0%) from August, rounding out a subdued quarter. Year-over-year, deal value was down 21%.
 Strategic buyer deal value increased 35% in September from August to approximately $300 billion, as strategic buyers accounted for a larger share (about 77%) of overall deal value. Year-over-year, strategic deal value was up 10%.

Private equity (sponsor) deal value plummeted 47% from August to September to approximately $90 billion, the lowest sponsor deal value in the trailing 13-month window. Year-over-year, sponsor deal value was down 59%.
 Monthly Deal Count Trends
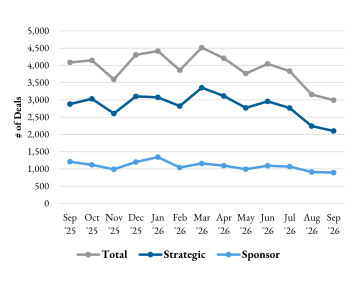
Global deal count in September declined 5% from August to just under 3,000 transactions, a three-year low. Year-over-year, global deal count was down 27%.
Strategic buyer deal count was down 6% from August to September, to approximately 2,100 transactions. Year-over-year, strategic buyer deal count was down 27%.
Sponsor deal count in September was roughly steady (-2%) with August at just under 900 transactions. Year-over-year, sponsor deal count was down 26%.
Monthly Active M&A Industries (U.S. Targets)
 By Deal Count
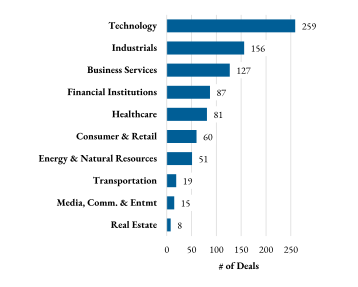
- The technology sector remained at the top for U.S. M&A activity by deal count in September with more than 250 deals, about level with last month and continuing its multiyear streak as the leading industry by volume.
- Industrials rose to second place, including (among more than 150 others) the GE Aerospace-CPP transaction highlighted below.
 By Deal Value
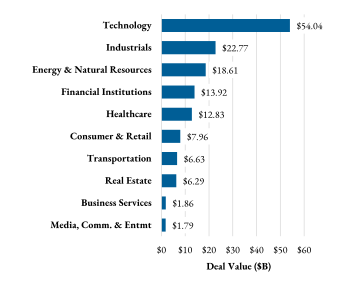
- The technology sector also topped the charts for U.S. M&A activity by deal value in September with approximately $54 billion, led by the NVIDIA-Hugging Face deal highlighted below.
- Industrials took second place by deal value as well, bolstered by the second and third largest transactions of the month. Energy & natural resources took third place with seven deals above $1 billion.
Monthly Blockbuster Deals
 Largest U.S. Technology Deal
- NVIDIA has agreed to acquire Hugging Face in a transaction valued at approximately $12.9 billion.
 Largest U.S. Industrials Deal
- GE Aerospace has agreed to acquire Consolidated Precision Products in a transaction valued at approximately $11.75 billion.
 Monthly Inbound U.S. M&A Activity
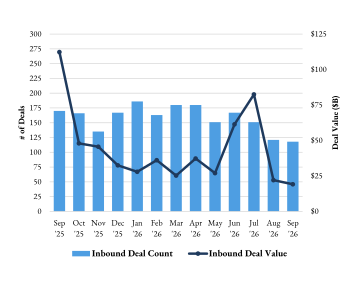
By deal value, crossborder inbound U.S. activity in September declined 13% from August to approximately $19 billion, with eight deals over $1 billion. Year-over-year, inbound deal value was down 83% from September 2025’s outlier high.
By deal count, acquisitions of U.S. targets by non-U.S. buyers in September were about steady (-2%) with August. Year-over-year, inbound deal count was down 31%.
- Canadian acquirers undertook the largest number of inbound transactions in September, followed by the UK. Japan, Italy, and France were also active acquirers.
 Monthly Outbound U.S. M&A Activity
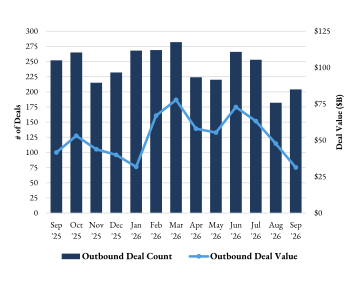
By deal value, acquisitions of non-U.S. targets by U.S. buyers in September fell 34% from August to approximately $31 billion. Year-over-year, outbound deal value was down 25%.
Crossborder outbound deal count was up 12% in September from August to just over 200 transactions. Year-over-year, outbound deal count was down 19%.
- In September, U.S. acquirers predominantly targeted the UK, followed by Canada and Germany. Australia, France, and Spain were also popular target countries.

Quarterly Global M&A Activity
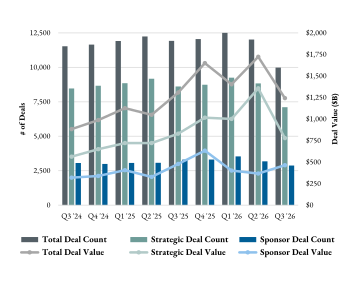
- Global Q3 2026 M&A activity declined from the record-setting Q2 2026 across most metrics. Global deal value dropped 28% to approximately $1.2 trillion. Compared with the same period last year (Q3 2025), aggregate deal value was down 5%.
- Sponsor buyer deal value moderately increased quarter-over-quarter, up 26% from Q2 2026 but down 3% from the same period last year. Strategic deal value was down 43% quarter-over-quarter and down 6% year-over-year.
- Global deal count decreased 17% quarter-over-quarter, with activity by strategics (-20%) falling further than sponsors (-10%). Compared to Q3 2025, deal count was down 16%.
 Quarterly U.S. Crossborder Activity
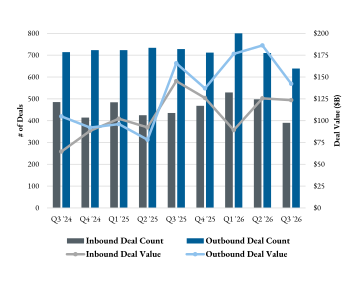
- U.S. crossborder activity declined in Q3 2026 quarter-over-quarter. Inbound deal value was nearly steady (-2%) while outbound value was down 24%. Deal counts fell across the board, with inbound down 22% and outbound down 10%.
- Compared with the same period last year (Q3 2025), inbound and outbound deal value were down 15% and 14%, respectively.
- Compared with Q3 2025, inbound crossborder deal count was down 10%, and outbound count was down 12%.
- Unless otherwise noted, charts compiled using Mergermarket announced deals for September 2026 as of October 5, 2026. Aggregate deal values by dollar amount are calculated from the subset of deals with disclosed values.























Stay Up To Date with Ropes & Gray
Ropes & Gray attorneys provide timely analysis on legal developments, court decisions and changes in legislation and regulations.
Stay in the loop with all things Ropes & Gray, and find out more about our people, culture, initiatives and everything that’s happening.
We regularly notify our clients and contacts of significant legal developments, news, webinars and teleconferences that affect their industries.